6.13 Connectivity Tester
The Connectivity Tester provides an alternative to Bruno for executing and testing connectable elements directly within the platform. It is designed to simplify debugging and provide clear visibility into execution flows, especially for connectors and workflows.
Accessing the Connectivity Tester
To open the Connectivity Tester, click the Play button on any element in the editor.
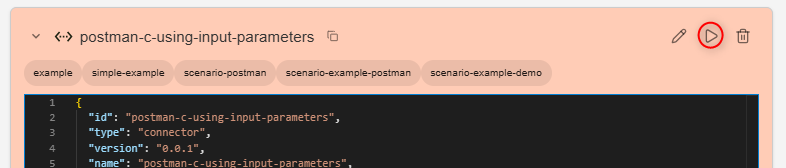
It is also possible to open the Connectivity Tester by using this base URL and adding the query parameters to the URL, as shown below.
Query parameters
You can extend the base URL with query parameters to control which elements load and which one is selected when the Connectivity Tester opens. Encode the query string as usual in URLs (for example, commas in ids become %2C).
Base URL:
https://app.<tenant>.<cluster>.<domain>/?config=olive-connectivity-tester
ids
The ids parameter is a comma-separated list of element IDs. Those IDs appear in the left sidebar so you can open and run each listed element from the tester.
Example:
postman-c-using-input-parameters,postman-dp-http-postman-get-placeholder,postman-dp-http-postman-post-placeholder
Separated IDs:
postman-c-using-input-parameterspostman-dp-http-postman-get-placeholderpostman-dp-http-postman-post-placeholder
activeId
The activeId parameter sets the element that is selected when the page loads. The tester shows that element in the main view, and the Play control runs that element. activeId must be one of the IDs you passed in ids.
This is set by default if you click the Play button on any element in the editor.
Example:
activeId=postman-c-using-input-parameters
Example URL
Opening a URL like the following loads the Connectivity Tester with three sidebar entries, selects postman-c-using-input-parameters as the active element, and runs that element when you use Play. You can switch to the other listed elements from the sidebar.
https://app.<tenant>.<cluster>.<domain>/?config=olive-connectivity-tester&ids=postman-c-using-input-parameters%2Cpostman-dp-http-postman-get-placeholder%2Cpostman-dp-http-postman-post-placeholder&activeId=postman-c-using-input-parameters
The config parameter determines which microfrontend is loaded. In this case, config=olive-connectivity-tester opens the Connectivity Tester.
This opens a new tab that includes:
- The selected element
- Any connected elements (e.g., datapoints in a connector), if there are any connected elements
- An input JSON field to provide input to the selected element
- A button to execute the element
- Results of the execution
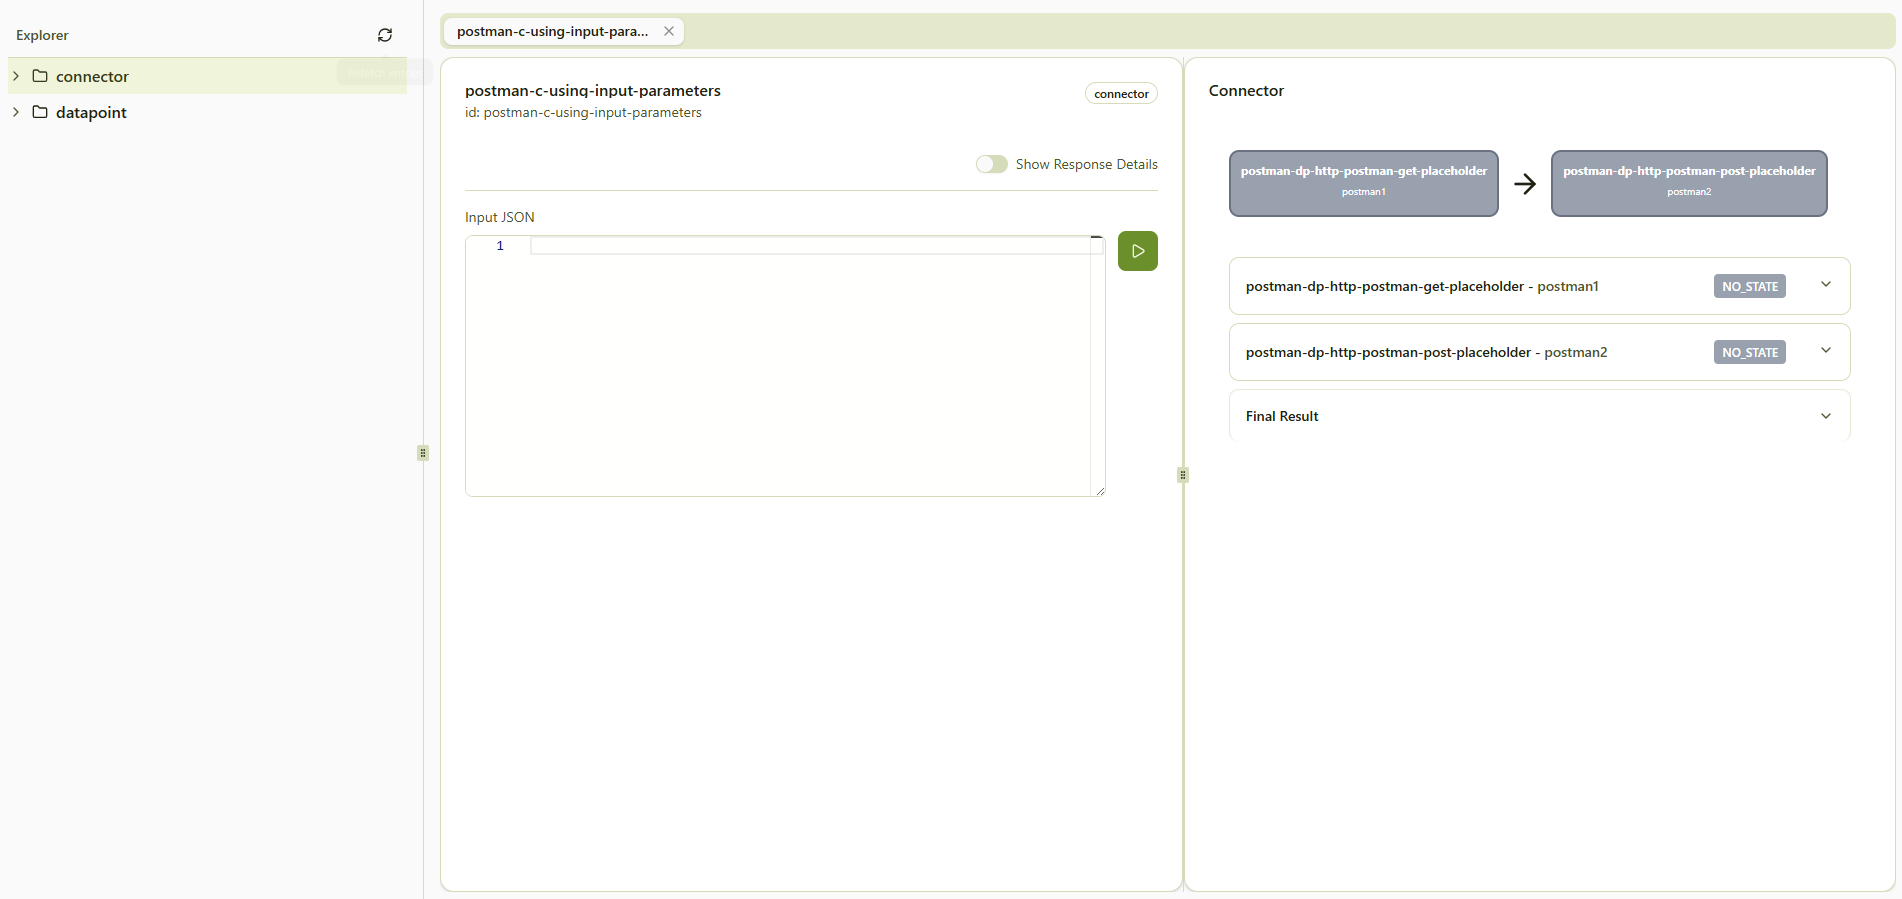
You can navigate between these elements using the left sidebar, allowing you to inspect and test each part of the execution flow individually.
How to use the Connectivity Tester
To use the Connectivity Tester, follow these steps.
If the selected element requires input, you can provide it in the Input JSON field.
- Enter only the required parameters
- Ensure the structure matches the expected schema
Unlike an API client such as Bruno, parameters do not need to be wrapped in an input object — provide
them directly at the top level. The tester adds the envelope for you.
A body copied from Bruno into the tester arrives as a single parameter called input, and a body copied
from the tester into Bruno sends no parameters at all.
The five places the word input appears, and how they combine, are set out in Where "input" actually goes.
To execute the element, click the Play button next to the Input JSON field.
Example execution
The following walkthrough uses a small connector, postman-c-using-input-parameters, that runs two HTTP datapoints in sequence (a GET-style call followed by a POST-style call against Postman Echo). You can open the same layout by launching the Connectivity Tester with the connector as activeId and listing the connector plus both datapoint IDs in ids, as shown in the example URL above.
Arrange the run
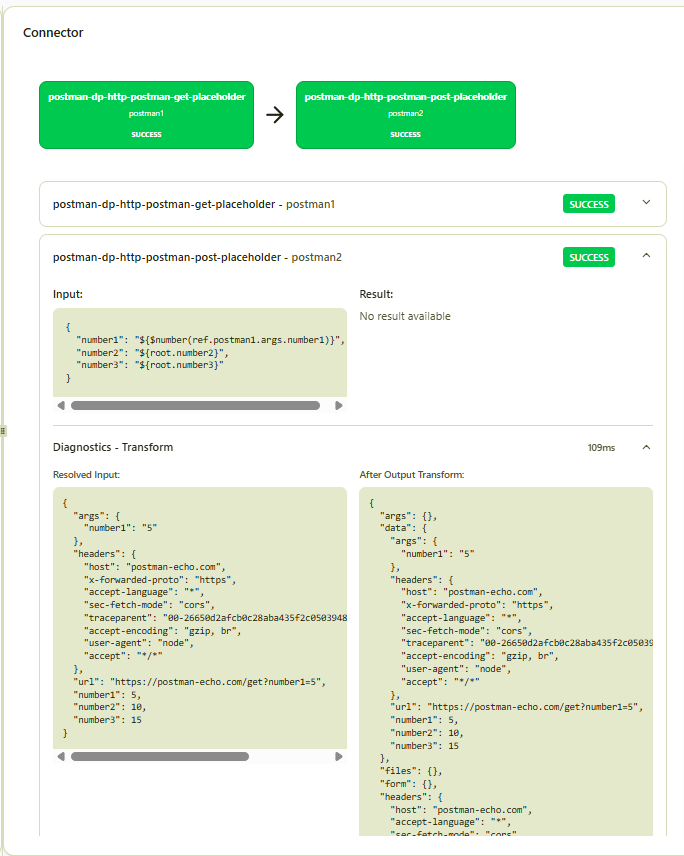
The left sidebar lists the connector under connector and each datapoint under datapoint. Select the connector to drive the full flow from the main panel. The center area shows the element id, the Input JSON field, and Play. The right side shows the connector graph: here the first step is postman-dp-http-postman-get-placeholder (postman1), then postman-dp-http-postman-post-placeholder (postman2).
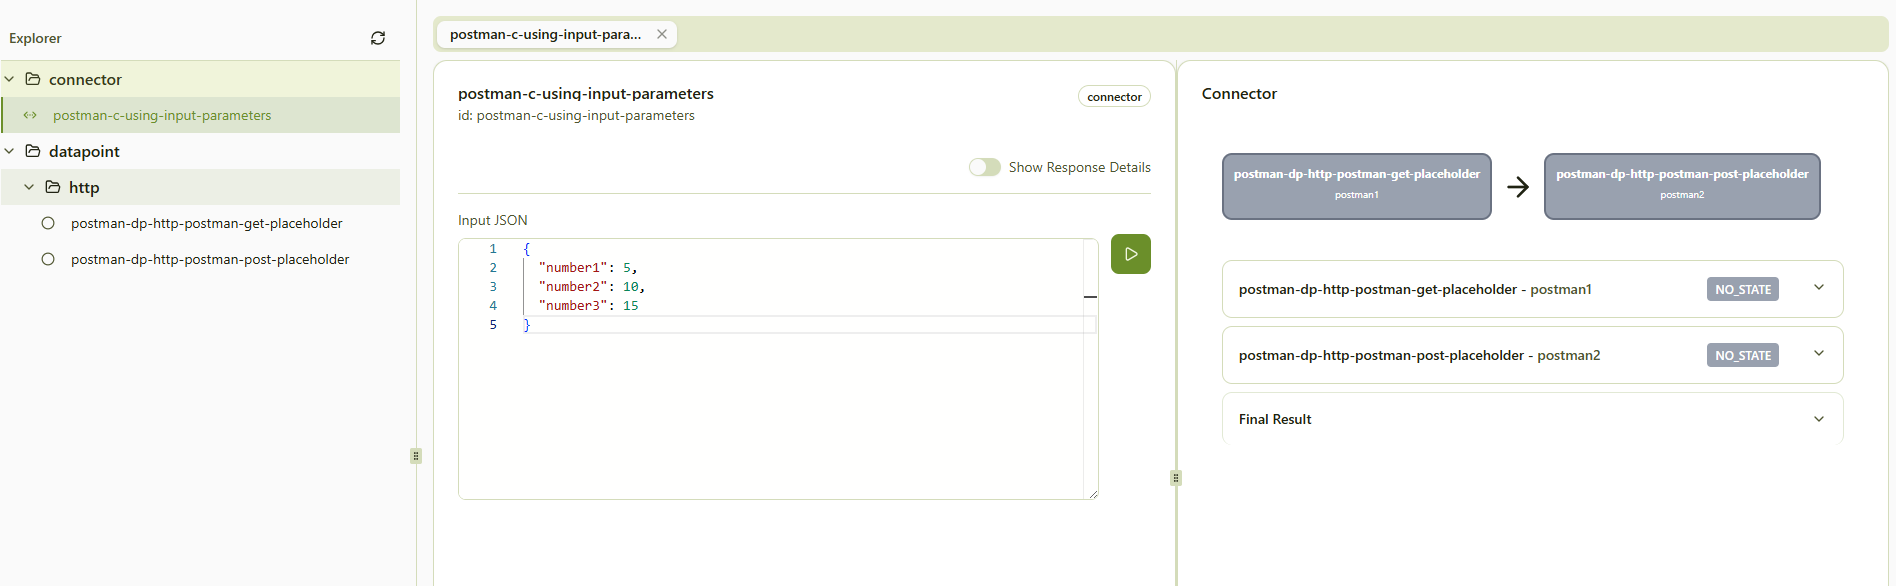
Provide input and execute
Enter the connector input as top-level JSON (no extra input wrapper). For this example, three numeric fields are enough:
{
  "number1": 5,
  "number2": 10,
  "number3": 15
}
Click Play to run the connector. The flow diagram updates to show each step as it finishes; expandable rows list every datapoint invocation with SUCCESS or error status.
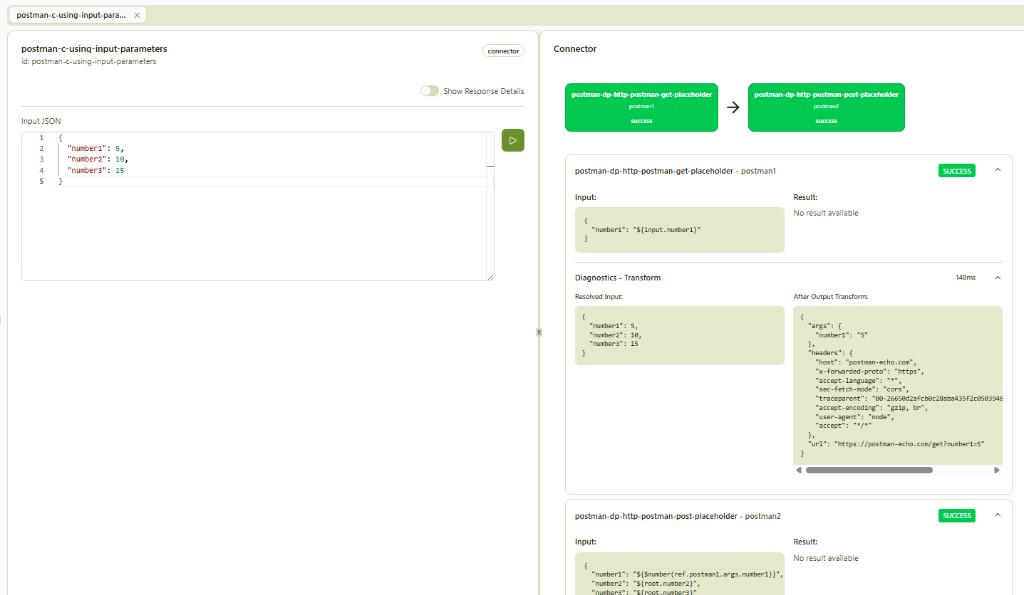
Inspect diagnostics and transforms
Expand a step to compare Input, Result, and the diagnostics panels. Resolved Input shows the payload the datapoint received after any input mapping or transforms. After Output Transform (when present) shows how the response was normalized before the next step consumed it. Use this to verify placeholders, headers, and URLs (for example the Postman Echo request URL and query args).
Read the final summary
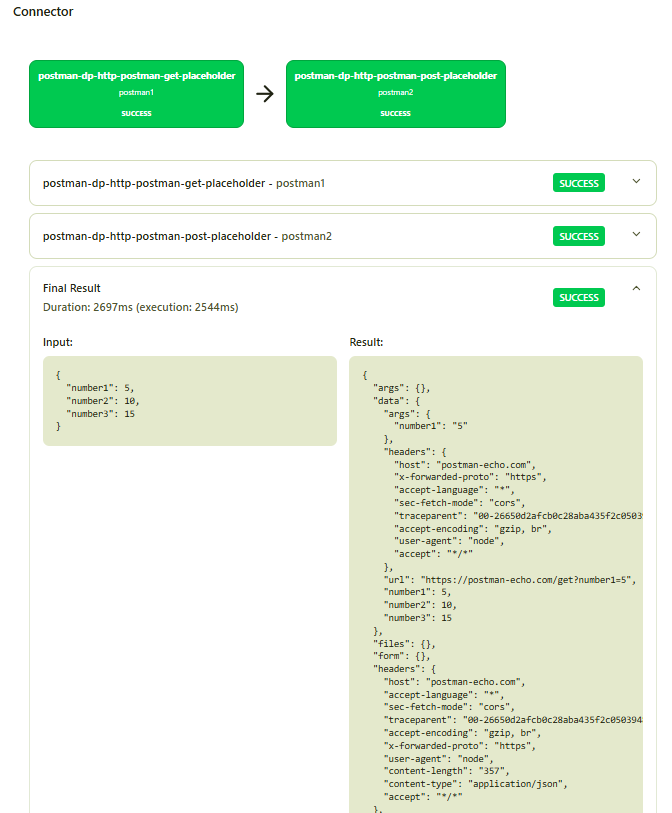
When the run completes, the summary reports overall status, duration, and the aggregated outcome. The input snapshot and result JSON confirm that arguments reached the echo service and returned as expected.
Element Execution Visualization
The example execution above shows the same building blocks you will see for other connectors: a flow diagram, one row per datapoint run, and expandable diagnostics. The sections below spell out how to read those parts when you move beyond the sample connector.
Flow order and status
For connectors, datapoints appear in execution order (not merely list order). Arrows and dependencies in the graph match how the orchestrator will run the steps.
Each step reports a status so you can see at a glance where time was spent and what failed:
| Status | Meaning |
|---|---|
| Executing / Invoked | In progress (yellow) |
| Successful | Finished without error (green) |
| Failed | Error or abnormal exit (red) |
| Not executed | Skipped or never reached (greyed out) |
Use the graph for the story of the run; use the per-step rows when you need exact inputs, outputs, and timing for one invocation.
Step diagnostics (reference)
When you expand a step, as in Inspect diagnostics and transforms, the panels have consistent roles:
- Resolved Input – Payload the datapoint actually received after any input mapping or transforms
- Output – Raw or transformed result produced by the datapoint
- Transformation details (when shown) – Intermediate mapping or normalization between input/output and the rest of the flow
Together, these let you follow how data changes from the connector entry point through each HTTP call or other step.
Final Output and Summary
When the run finishes, the view described in Read the final summary appears for any connector or connectable element: a single place to confirm overall success, duration, and the final payload without opening every step.
Typical contents:
- Overall status – Whether the whole execution succeeded or failed
- Timing – Total and per-phase duration when shown
- Input and result snapshots – What was sent in and what came back at the end of the flow
- Step roll-up – High-level view of each step’s outcome (useful before drilling into diagnostics)
Start from the summary for a pass/fail decision; open individual steps only when you need the full request, response, and transform trail.