5.4 Troubleshooting & Debugging
For detailed execution insights and easier debugging, you can use the Temporal Web UI. The UI provides a comprehensive view of workflow execution, including workflow history, task progress, retries, failures, and state transitions.
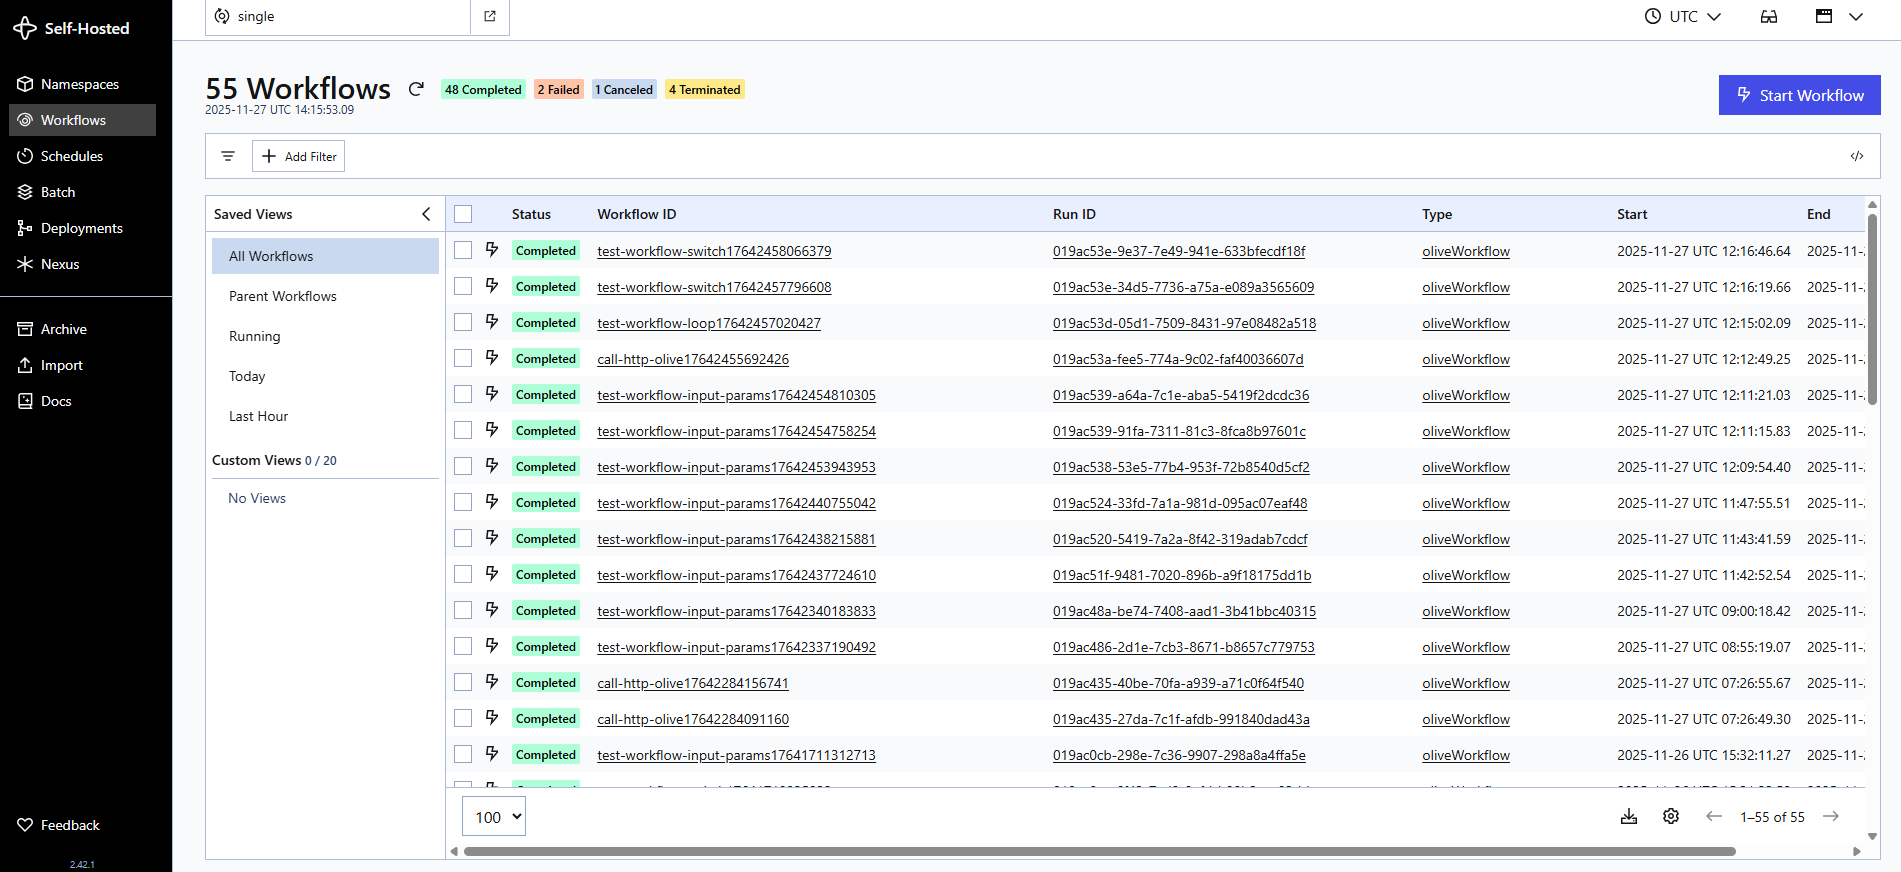
Getting access to the Temporal Web UI
It is off in every deployment (secure by default), and it provides no tenant isolation — anyone who can reach it sees every tenant's workflow executions. It is meant for debugging in a development deployment, not for production.
Turning it on is a change to the deployment's values.yaml, which a connectivity engineer does not have access to. Ask your OLIVE operator to enable it, and tell them which deployment you need it in.
Ask for it on a development deployment. In a production deployment the UI runs in the shared runtime pool, where it would expose every tenant's workflow executions, so it is not enabled there when real customer data is involved — and the change also has to be made in two places rather than one.
They will find the procedure in the administrator and operator manual, under Maintenance → Troubleshoot Temporal Deployment.
Once it is enabled, the UI is reachable at:
https://workflow.<tenant>.<cluster>.<domain>/

for example, https://workflow.acme.prod.yourdomain.com/
For detailed guidance on navigating and using the Temporal Web UI, refer to the official Temporal documentation: https://docs.temporal.io/